
Note to the reader: This is the twenty-fourth in a series of articles I’m publishing here taken from my book, “Investing with the Trend.” Hopefully, you will find this content useful. Market myths are generally perpetuated by repetition, misleading symbolic connections, and the complete ignorance of facts. The world of finance is full of such tendencies, and here, you’ll see some examples. Please keep in mind that not all of these examples are totally misleading — they are sometimes valid — but have too many holes in them to be worthwhile as investment concepts. And not all are directly related to investing and finance. Enjoy! – Greg
What better way to see how all this information on rules-based trend analysis can actually be put to work and used in a successful practice? The following are interviews with Jud Doherty, then-president at Stadion Money Management, LLC, and Will McGough, then-VP Portfolio Management. (These interviews were conducted prior to 2013.) Stadion is a money management company that, in 2004, Defined Contribution news named Advice Provider of the Year in the retirement plan industry. As of 2013, Stadion has more than $6 billion under management in separately managed accounts, six mutual funds, and retirement 401(k) plans.
When did you first get interested in the markets?
(Jud) My first job out of college in 1991 was in 401(k) recordkeeping, which was an operational role. But it gave me exposure to the mutual fund world and insight into the behavior of the typical investor. To gain greater investment knowledge, I entered the CFA program, which led to the next phase of my career, which was institutional investment consulting.
(Will) From a young age I decided to focus my studies on math over literature, after all there are only 10 basic numbers (counting 0) versus 26 letters, so the odds were in my favor! Mathematics was a natural segue to financial market interest as I grew older. I was also fortunate enough to have family members who tweaked my interest in the markets. My grandfather was a big IBD proponent and gave me a few shares of stock after I graduated from high school. Watching the volatility during the late 1990s/early 2000s, I knew there had to be a better way to invest than to watch wild swings and P&L. Then, freshly out of school, I was supposed to study for the CFA program by getting to work early, but, instead, spent all my time during the morning darkness studying the markets. Each day, the markets behave differently, which is essential in keeping the thirst for knowledge alive.
Can you describe the overall methodology of your approach to the markets?
(Jud) I am a firm believer in active management to add safety, not return, and that a disciplined process is critical to success. Gut feelings, emotions, predictions, and forecasts may work once in a while, but are a long-term recipe for disaster.
(Will) It’s all about probabilities. We want to participate when the odds are in our favor of price continuing to go higher, and want to protect against times when the odds are signaling detrimental price action. We do this from analyzing price trends, the strength of those trends via market breadth, which is equal-weighted participation, and through relative strength, which is determined when speculative markets like small-cap and emerging markets are leading the way. From there, we get an overall picture of market health, which we have broken down into various levels to drive asset allocation, security selection, and sell criteria metrics. The final key is knowing when to cut losses via sell criteria; there is no question that we have the discipline to follow this approach no matter how wrong it may feel at times.
How did you come up with the breadth indicators that you use today?
(Will) Most of the measures we use are simple variations of classic indicators that are common to the technical analysis community.
How have these procedures done over the years?
(Jud) Active management has underperformed since the lows of 2009, but this is to be expected. Anyone who has kept pace with the market the last few years should be questioned, because they likely have not made any moves that would (or will) protect their portfolio when the next inevitable bear market occurs.
(Will) Trend following with momentum has the ability over the short term to disconnect from market performance. Whipsaws will eventually lead to underperforming bull markets, and large loss avoidance will make the strategy very appealing after bear markets. But it’s the full market cycle that counts. After combining the strengths during bears and weaknesses during bulls, the goal is to have market-like returns with unmarket-like volatility.
Have you made any changes to the procedures over the years?
(Jud) Changes to philosophy and model have been nonexistent, but due to changing markets and opportunities, various indicators and components within our model have changed. For example, breadth will always be an indicator of market health in my opinion, but how breadth is calculated or measured may change over time based on index construction and market evolution.
(Will) Changes are much akin to natural evolution. A Lexus today isn’t the same Lexus as 20 years ago, but it’s still a Lexus. Stadion’s investment philosophy is still the same and the tactical model still follows the same mandate. The beauty of our approach is that we are not reliant on a single indicator; it’s the collective voice of our basket of indicators that guides us. Therefore, when research dictates a new method, calculation, or rule be added, the plug-and-play nature of our approach means changes are along the fringe rather than at the heart of what we do.
What changes have you made and why?
(Will) One example of a change is our relative strength measure. For many years, actually over a decade ago, we measured speculation by looking at exchanges, primarily, the NYSE versus Nasdaq. Over the years, listing requirements have changed and new vehicles like ETFs have come about causing the price indices that track these exchanges to be influenced by factors that were not a part of the original indicator thesis. Therefore, we moved to a pure common stock approach by measuring the same original intent by using the S&P 500 and Russell 2000.
What type of assets does Stadion manage; only mutual funds?
(Jud) Stadion manages 401(k) accounts, collective investment trusts (CITs), separately managed accounts, and mutual funds. But the underlying philosophy of all of these vehicles is active management to protect during devastating bear markets.
Is your model used for all the assets or just some?
(Jud) All assets we manage at Stadion are governed by strict rules, and in a team environment. Virtually all are managed actively/tactically, though we do have a small portion that is allocated strategically in our 401(k) accounts.
(Will) As Stadion grows there could be different types of models and strategies, but everything we do will be outlined by following a rules-based disciplined process.
Why do you think breadth does so well in a trend following model?
(Will) Breadth is a derivative of price. The most common type of breadth is advancing versus declining issues, which looks at the number of stocks moving up or down in price across an index or exchange. When market cap or price-weighted indexes performance is driven by those higher-weighted constituents in the face the equal-weighted voice of the entire index, you begin to see breadth divergences. This leading of price gives breadth merit in trend-following systems.
What do you think of the NYSE having about 50% of its issues as interest sensitive? Does that affect your model?
(Will) Funny you mention that. Earlier, when I talked about changes to our process, the one item affecting our relative strength measure that I didn’t bring up was interest-sensitive securities like preferred issues. Not only did this constituency affect our relative strength measure, but it was detrimental to our source of breadth. Since these securities would move contrary to more common equity stocks, our breadth measures using NYSE data were affected. Using a purer stock membership and speculative index in the Nasdaq has enhanced our trend following breadth measures.
You said that you look at only Nasdaq breadth data. Why? Is there any other breadth data that you use?
(Will) Currently, our approach is predicated off of Nasdaq market data. We believe the Nasdaq to represent the broadest, most speculative measure of risk in the U.S. market place. The Nasdaq has less stringent listing requirements, so it has a natural downside bias over time as more securities go from the exchange than come to it, this allows periods of ample speculation to show more predominately than its bellwether brother NYSE.
What is the Ulcer Index?
(Will) The Ulcer Index attempts to quantify risk around measuring drawdowns. Drawdowns are the true source of risk that investors face, not some normal distribution variance around a mean return. Note from author: The Ulcer Index is also covered as a ranking measure in Part 4 of this section.
Do you care to comment on this? “Nobody can feed a family with reduced downside; however, it is far easier to recover from difficult periods.”
(Jud) Total return is what matters in the end. But if two strategies have identical returns and one of them has bigger drawdowns, most people simply can’t tolerate that and will abandon the strategy. We believe lower drawdowns lead to better sleep at night and a higher likelihood of investors sticking with a given strategy. In other words, high drawdown equals strategy abandoning equals performance chasing equals lack of meeting investing goals.
(Will) Most definitely, this is the value of compounding at its finest. To recover from a 20% loss takes a 33% return. To recover from a 5% loss takes a 5.3% return. It is much easier to recover from small losses than it is large losses. Most people focus on how much return they can get in upmarkets, but the key to investing is really the loss avoidance.
I believe you said you would share some of the research that Stadion has done in regard to the indicators and models you mentioned earlier. How about it?
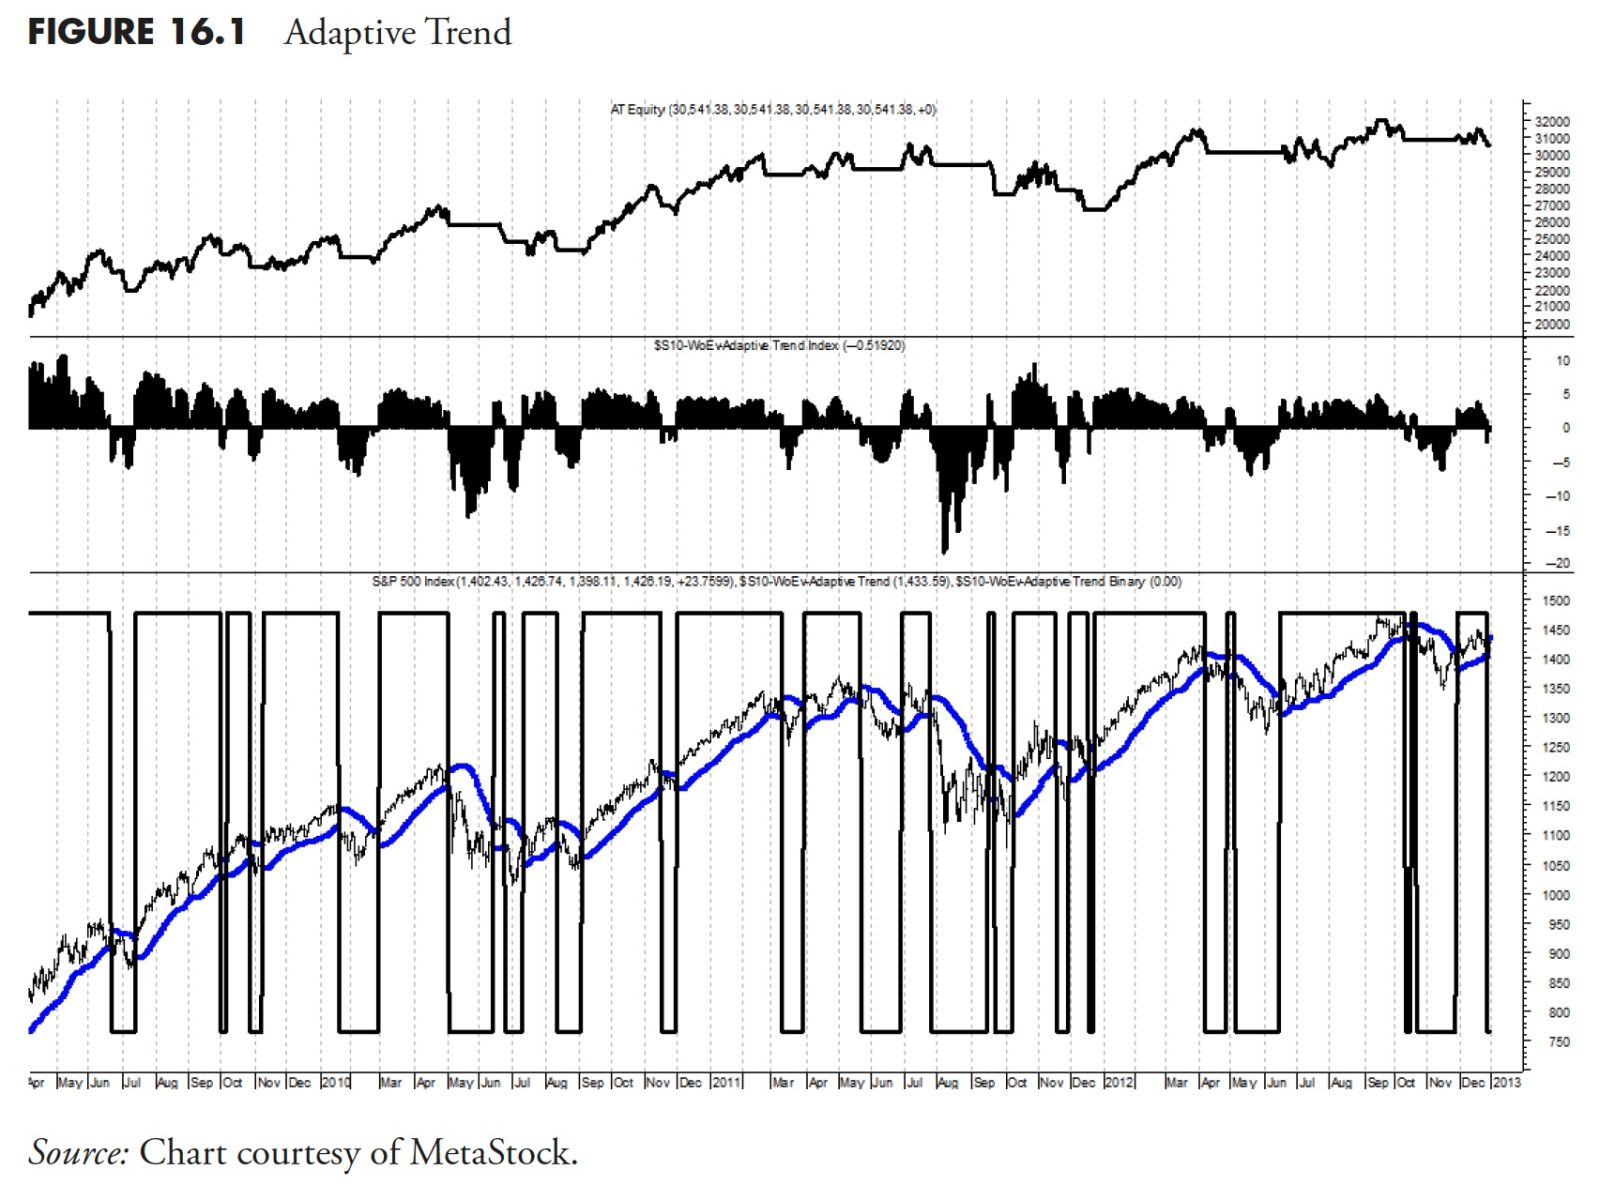
(Will) Thanks Greg, let me show you two different ways we approach indicators and systems. The system part will actually reference this, and your previous book on breadth and will fully disclose those indications. First, let me show you a specific trend following price indicator. This is a classic variation of common approaches. We call it “adaptive trend.” Since it’s proprietary, I can’t tell the exact formula, but here is what it is: it is a midpoint moving average with a volatility-adjusted average true range band around it as a buy/sell trigger. As volatility and range expands, the lower-bound band tightens up for quicker exits, and the exact happens for smooth trends, low volatility and more “standard” ATR allows more investible flexibility. Our Adaptive Trend indicator averages about four to five trades per year while only being invested approximately 60% of the time, which annualizing a return of about 14 percent from 1971 to 2012 (versus 8 percent for the Nasdaq). It has a peak drawdown of 30 percent, and an Ulcer Index (risk) of 7.5, which is about 20% of the risk buy-and-hold carries with the Nasdaq Ulcer index of 35. Our results include no return on cash and do not factor in for trading costs or slippage. Based on our actual trading data using ETFs for many years, our actual costs vary between 10 and 20 basis points per year. Figure 16.1 shows the equity line in the top plot, the adaptive trend index in the middle plot and the S&P 500 with adaptive trend in the lower plot. The binary of the signals is overlaid on the S&P 500 in the lower plot. You can clearly see it does an excellent job of picking market turns.
Figure 16.2 is a view of the equity line (top line) versus the Nasdaq Composite (lower line) over the longer term. As you can tell, chipping away at upmarkets but avoiding the bears is the key to success.
Next, let me show you how to take trend following one step further. Building a basket of indicators to identify trends can be very helpful, so let me explain. I’m going to make this one very simple. As you know, we are huge fans of the work that the McClellans have done over the years. We also believe in the 5% and 10% exponential averages (39- and 19-day respectively). So let’s take three longer-term indications to develop an environment for when trends should occur. Here is what we will use:
Nasdaq McClellan Summation Index > 1000 (using the Miekka adjustment), formula in your book, The Complete Guide To Market Breadth Indicators.Ten percent Trend of Nasdaq New Highs > 10 percent Trend of Nasdaq New Lows, a 19-period exponential moving average of each breadth series (I think this is in your book also).Two-hundred-day exponential average of the Nasdaq Composite.
Table 16.1 is a summary of the stand-alone signal results, obviously better than buy-and-hold but none of them all that great.
Now if we start to combine them in a two-out-of-three and three-out-of-three format (see Table 16.2), we start to see remarkably less risky environments, but with lower return. It’s the classic risk/return trade off. But we do have a solution of keeping a lower-risk environment while matching market return.
For this we now add an intermediate trend following signal (see Table 16.3), the 19/39 price oscillator on the Nasdaq Composite. Once we add this, we can then build out a set of system rules. For the two of three with the price oscillator, we will be 50% invested; for three of three without the oscillator, 75% invested; and, finally, 100% invested when all components are on (3 of 3 for our basket and price trend oscillator positive). You can see from Table 16.3 that this system yielded a return close to Buy and Hold, but with considerably less risk as measured by the Ulcer Index, percent of time invested, and maximum drawdown. I think it is fairly clear this process reduces the risk and helps the return, which was the goal.
Any short bit of advice to investors that you would like to share?
(Jud) Do not chase performance! It is almost a guarantee that the worst time to fire a manager is when you most want to!
(Will) Investors need to understand what it is they want to accomplish by setting goals and staying within rules and boundaries of a process. By having a vision and process combined with the discipline to stick with it, whatever they seek to do will work as long as their methodology is sound and reasonable. For many, this takes many years, patience, and maturity to attain!
Thanks, Jud and Will.
This concludes Part III: Rules-Based Money Management.
Thanks for reading this far. I intend to publish one article in this series every week. Can’t wait? The book is for sale here.